Manual Editing
While AI generation is a great way to get started quickly, you'll often want to build or refine your logic model by hand. MUSE gives you full control: you can add nodes of any type, write custom descriptions, attach metrics that will feed into the Measurement Recipe, and draw causal connections exactly the way you want.
Adding a New Node
To add a node manually:
- Click the "Add Node" button in the toolbar at the top of the canvas.
- A centered dialog opens with a two-column layout — basic info on the left, metrics on the right.
- Fill out the form (see details below).
- Click "Add card" at the bottom right to place the node on the canvas.
The Node Editor Dialog
The Node Editor Dialog is the same interface used for both adding a new node and editing an existing one. It's split into two sections:
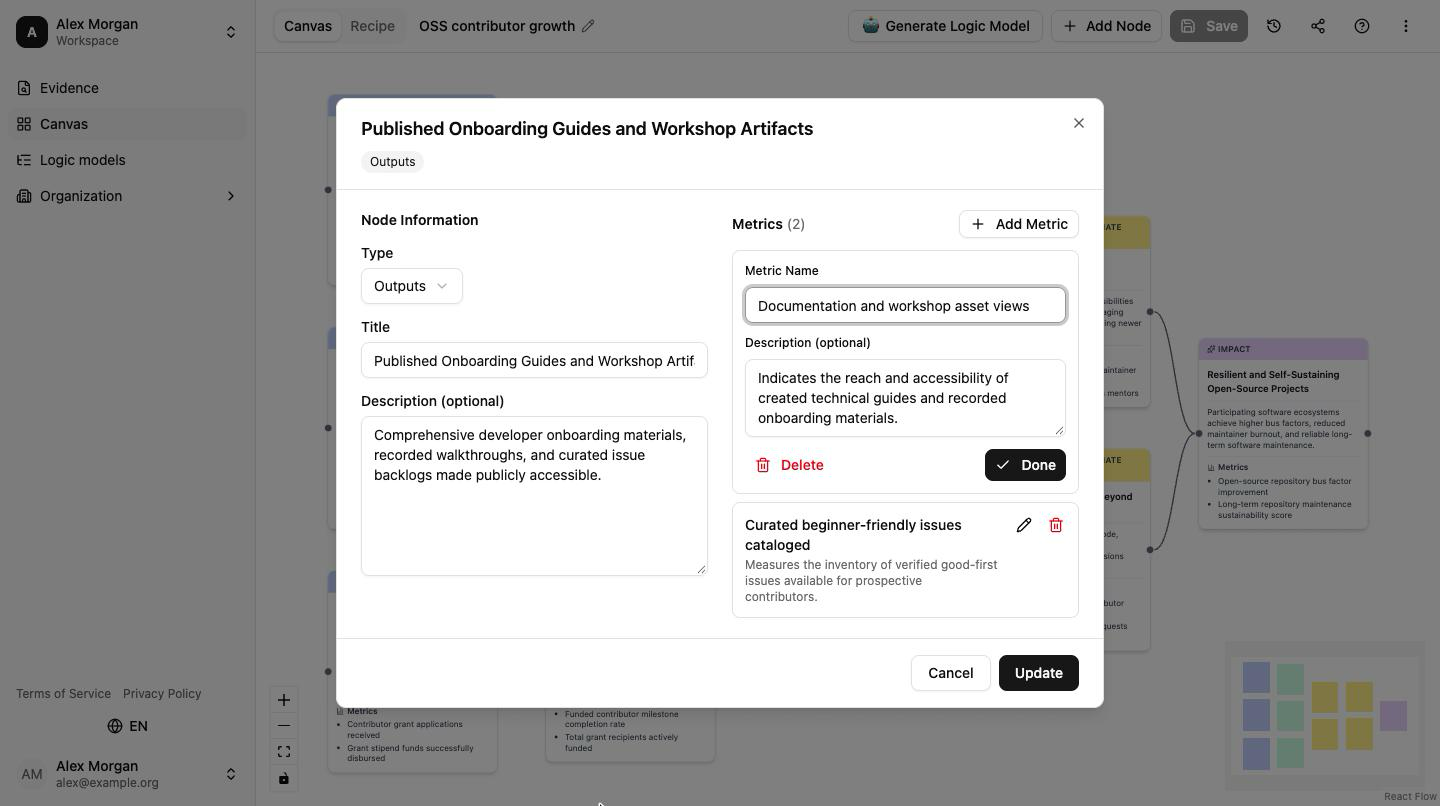
Left column — basic info:
- Type (required) — Pick one of the five node types from the dropdown.
- Title (required) — A short, clear name for this node. Maximum 100 characters.
- Description (optional) — A longer explanation of what this node represents. Maximum 500 characters.
Right column — metrics:
- An "Add metric" button that appends a new metric card and auto-expands it for editing.
- A list of any metrics you've already added.
- If there are no metrics yet, a dashed placeholder tells you the section is empty.
At the bottom of the dialog, a pinned footer holds Cancel and Add card (or Update when editing).
Node Type Reference
| Type | Color | When to use |
|---|---|---|
| Activities | Blue | Actions or interventions your program carries out |
| Outputs | Green | Direct, countable products of your activities |
| Short-term Outcomes | Yellow | Immediate changes in knowledge, behavior, or skills |
| Intermediate Outcomes | Yellow | Medium-term changes building toward your goal |
| Impact | Purple | The long-term societal change you are aiming for |
Title Examples
Good titles are specific enough to be meaningful at a glance:
- "Run weekly nutrition workshops" (Activity)
- "Participants with improved dietary habits" (Output)
- "Reduced rates of childhood obesity in target schools" (Impact)
Adding Metrics to a Node
Metrics let you attach measurable indicators to any node in your logic model. In MUSE, a logic-model metric is intentionally lightweight — just a name and an optional description. The measurement details (how to collect the data, how often, target values, cautions) are elaborated later by the Measurement Recipe agent using the metric name plus the parent card's context.
To add a metric inside the Node Editor Dialog:
- In the Metrics section on the right, click Add metric.
- A new metric card appears at the bottom of the list and auto-expands.
- Fill in the fields:
| Field | Required? | Description |
|---|---|---|
| Name | Yes | What you are measuring (e.g., "Literacy rate", "Number of participants") |
| Description | No | A one-sentence hint about what the metric captures. The Recipe agent uses this as the primary hint when generating measurement steps. |
- Click Done (the check-mark button) to collapse the card back into the list, or Delete (the trash icon) to remove it.
You can add multiple metrics to a single node — only one metric card is expanded at a time, so the dialog stays readable even with many metrics.
Logic-model metrics are the outline; the Measurement Recipe is the executable plan. If you know that a metric should be measured via a survey, put "post-event survey response" in the description — the Recipe agent will build the measurement steps around that intent. See the Measurement Recipe → for how the outline becomes an operational guide.
Editing an Existing Node
You can edit any node already on the canvas:
- Option 1: Hover over the node and click the pencil icon that appears.
- Option 2: Double-click anywhere on the node.
Both actions open the same Node Editor Dialog in edit mode. The header shows the current node's title on top and its type as a badge underneath. All the same fields are available — title, description, and metrics.
Make your changes and click Update in the footer to apply them. Click Cancel to close without saving.
Connecting Nodes with Arrows
Arrows represent causal connections: "this stage leads to that stage." Drawing an arrow is a simple drag operation:
- Hover over the source node (the one that causes the next stage).
- Small dots — called handles — will appear on the edges of the node.
- Click and drag from the right-side handle of the source node.
- Drag toward the left-side handle of the target node.
- Release the mouse when the handle on the target node highlights.
A new arrow will appear connecting the two nodes.
Arrows show the direction of causation. By convention, logic models flow left to right: Activities → Outputs → Short-term Outcomes → Intermediate Outcomes → Impact. You can connect nodes in any order, but keeping this left-to-right flow makes your model easier to read.
Deleting Nodes and Arrows
To delete a node:
- Click the node once to select it (a blue selection border appears).
- Press the Delete or Backspace key on your keyboard.
When you delete a node, all arrows connected to it are also removed. This cannot be undone, so make sure you want to remove it before pressing Delete.
To delete an arrow:
- Click on the arrow (it may be thin, so click right on the line).
- The arrow will highlight to show it's selected.
- Press Delete or Backspace.
Rearranging the Canvas
Drag any node to a new position by clicking and holding on the node body (not on a handle), then dragging it where you want. Other nodes will not move automatically — you'll need to rearrange them manually to get the layout you want.
If the arrangement drifts as you edit, you can restore an orderly left-to-right layout at any time from the More menu → Auto Layout. This is the same tidy-up pass that runs automatically after AI generation.
Layout tips:
- Arrange nodes so that the flow reads clearly from left to right
- Group related nodes vertically at the same stage
- Leave some space between nodes so arrows are easy to follow
- Use the minimap in the corner to get an overview as your model grows
- Use Auto Layout if you want MUSE to reset the arrangement for you
The visual arrangement of your canvas doesn't affect the underlying data. Arrange nodes in whatever way makes the most sense to you and your stakeholders.
Working with Large Models
If your canvas gets crowded:
- Zoom out with your mouse scroll wheel to see more of the model at once
- Use the minimap to navigate to different sections
- Pan by clicking and dragging on empty canvas space
- Auto Layout from the More menu to re-tidy the arrangement
- Consider whether some nodes can be merged into a single, well-described node to reduce clutter