Canvas Overview
The Canvas is the heart of MUSE. It's your interactive workspace where you build, visualize, and refine your logic model. Everything connects here — from AI-generated frameworks to manually crafted program pathways.
Navigate to musecanvas.app/canvas or click "Canvas" in the sidebar.
The first time you open an editable canvas, a short guided tour walks you through the main controls. You can replay it at any time with the help (?) icon in the canvas header.
Canvas and Recipe Tabs
The canvas view is split into two tabs at the top:
- Canvas — the interactive React Flow workspace where you build, edit, and connect nodes.
- Recipe — the Measurement Recipe view. Once you've generated a recipe, this tab shows practitioner-ready measurement guidance for every metric on your Output and Outcome cards.
A small dot appears on the Recipe tab while a recipe is generating, and an amber warning icon appears when the recipe is stale (the logic model has changed since it was generated).
Next to the tabs is the logic model's title. Click it to rename a saved logic model.
The toolbar on the right of the header shows actions relevant to whichever tab is active.
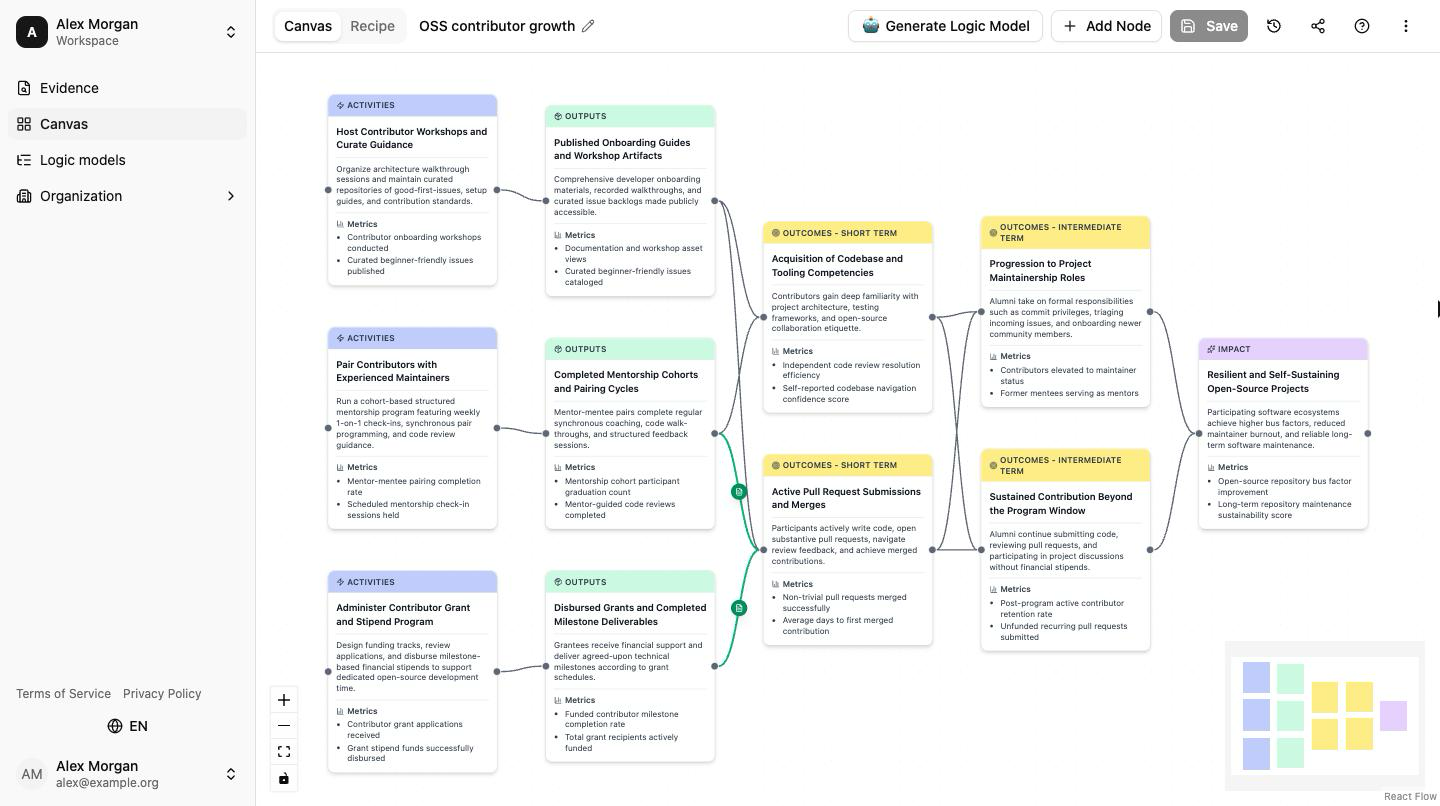
The Toolbar
The right side of the canvas header is the toolbar. On the Canvas tab it holds, from left to right:
| Button | What It Does |
|---|---|
| Generate Logic Model | Opens the AI generation dialog. Requires signing in |
| Add Node | Opens the Node Editor Dialog to add a node by hand |
| Save | Saves the logic model to the active workspace |
| History (clock icon) | Opens the version history |
| Share (share icon) | Opens the sharing settings |
| Start tour (help icon) | Replays the guided tour |
| More (⋮) | Opens a menu with layout, export, recipe, and clear actions |
On the Recipe tab, Generate Logic Model and Add Node are replaced by the recipe actions: Generate recipe, Regenerate, and Download HTML.
Save
Save stores the canvas in the workspace selected in the sidebar. The first save creates the logic model, and each later save adds a version.
- The button is disabled while there is nothing new to save, and reads Saving... while a save is in progress.
- If you are signed out, clicking it opens the sign-in dialog. Your draft is still on the canvas when you come back.
- Nothing is saved to the workspace automatically. Until you click Save, your edits exist only as a draft in the browser.
History
The History icon appears once the logic model has been saved. It opens a panel listing every version with its number, date, and author. Restore copies the chosen version as the newest one, so no version is lost.
Share
The Share icon appears on a saved logic model, and only for its owner. It opens a dialog with three independent settings:
- People gives individual workspace members view or edit access.
- Everyone in the workspace gives all members the same access.
- Anyone with the link turns on a read-only link that needs no account.
Each of these is explained in Saving & Sharing.
The "More" Menu
Click More to access additional actions, grouped by section:
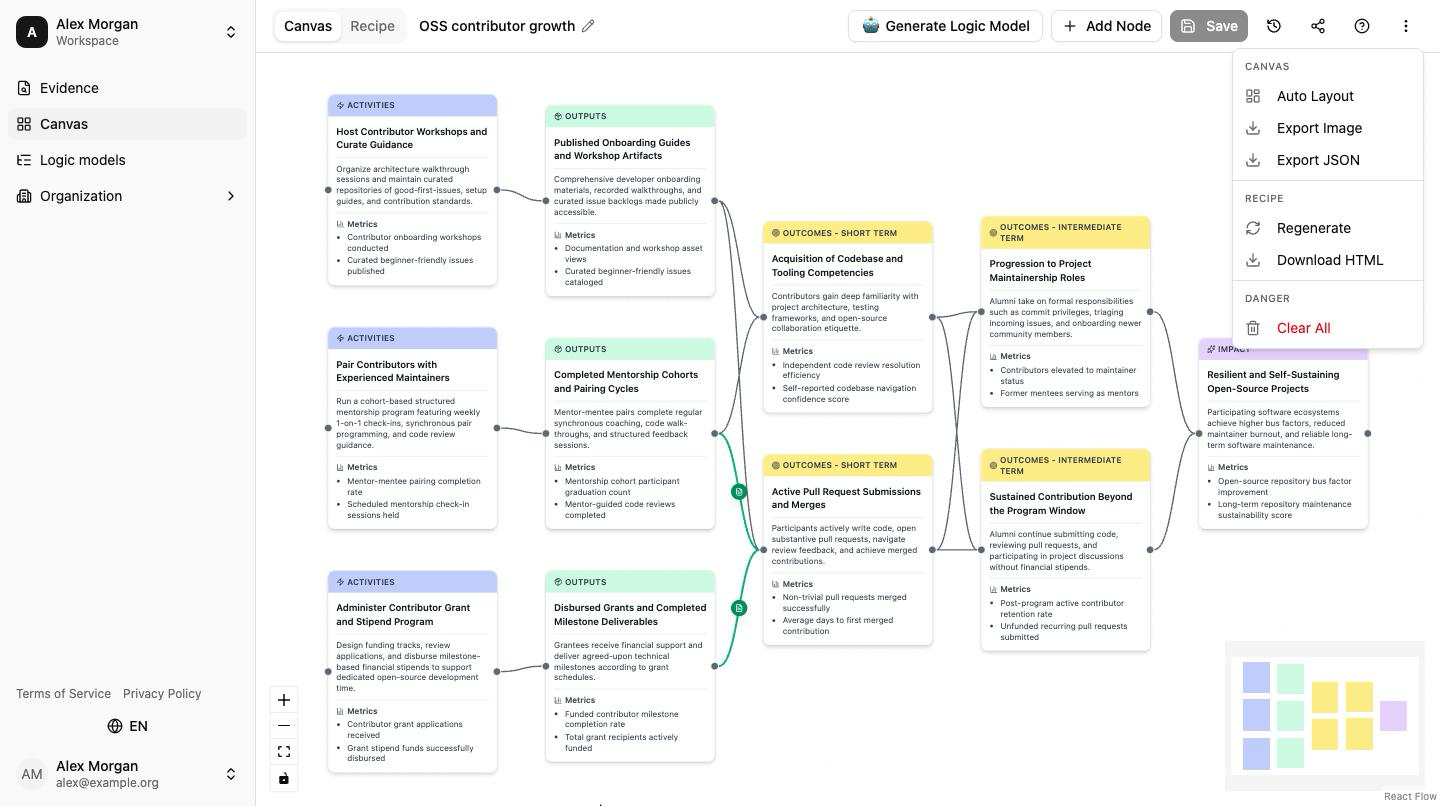
Canvas
- Auto Layout — Re-tidy the arrangement of nodes into a left-to-right layout (the same pass that runs automatically after AI generation)
- Export Image — Copy or download a PNG of your entire canvas, framed with a "MUSE" credit so the export is traceable when shared externally
- Export JSON — Download the raw logic model data as a file
Recipe
- Regenerate — Re-run the Measurement Recipe agent against the current metrics
- Download HTML — Download the current Recipe as a self-contained HTML file (disabled until a recipe has been generated successfully)
Danger
- Clear All — Remove everything from the canvas and start fresh
What Changes With Your Access
The toolbar shows only the actions you can use on the logic model that is open.
| Situation | Toolbar |
|---|---|
| New, unsaved canvas | Everything except History and Share |
| Saved logic model you own | Everything |
| Shared with you, Can edit | Everything except Share |
| Shared with you, Can view | History (without Restore) and More, which keeps Export Image, Export JSON, and the recipe items |
| Opened from a share link | More only, with the same items |
The Five Node Types
Your logic model is built from five types of nodes, each representing a different stage in your program's causal chain. Most types have their own color. Short-term and Intermediate Outcomes share the same yellow, so tell those two apart by the type label shown on each card:
| Node Type | Color | What It Represents | Example |
|---|---|---|---|
| Activities | Blue | The concrete actions your program carries out | Running training workshops |
| Outputs | Green | The direct, measurable results of your activities | 200 participants trained |
| Short-term Outcomes | Yellow | Early changes in knowledge, skills, or behavior | Increased digital literacy |
| Intermediate Outcomes | Yellow | Medium-term changes that build toward your goal | Higher employment rates |
| Impact | Purple | The long-term societal change you are working toward | Reduced economic inequality |
Read from left to right: Activities lead to Outputs, which lead to Short-term Outcomes, which lead to Intermediate Outcomes, which lead to Impact. Each arrow says "this causes that." The more evidence you can attach to each arrow, the more credible your model becomes.
Edges (Arrows)
Arrows on the canvas represent causal connections between nodes — the claim that one stage leads to the next.
- Regular arrows (gray/white) — A causal connection you've asserted in your model
- Green arrows — A causal connection that is backed by linked research evidence
When you see a green arrow, it means research evidence supports that specific step in your causal chain. Click on a green arrow to open a dialog showing the linked evidence. If external paper search was enabled during generation, you may also see academic papers from Semantic Scholar displayed as reference material alongside the curated evidence.
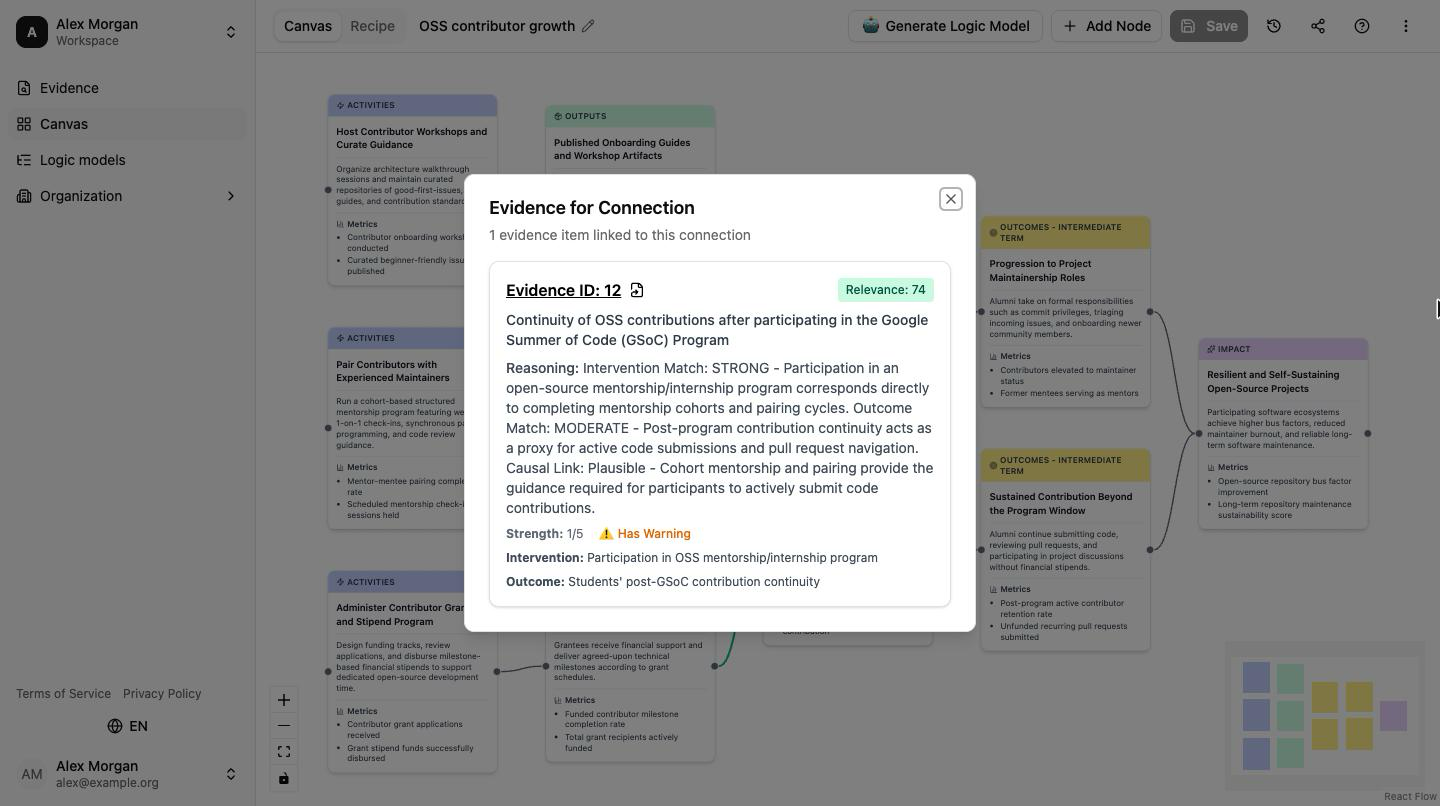
This is one of MUSE's most powerful features: turning assumptions into evidence-backed claims.
Navigating the Canvas
The canvas is an infinite, pannable workspace. Here's how to move around:
| Action | How To Do It |
|---|---|
| Pan (move around) | Click and drag on an empty area of the canvas |
| Zoom in | Scroll up with your mouse wheel, or use the + button in the zoom controls |
| Zoom out | Scroll down with your mouse wheel, or use the - button in the zoom controls |
| Fit to screen | Click the fit-to-screen button in the zoom controls to see your entire model |
| Minimap | Use the small map in the corner to get an overview and click to navigate |
Working with Nodes
Once nodes are on the canvas, you can interact with them in several ways:
| Action | How To Do It |
|---|---|
| Select a node | Click on it once — it will highlight with a selection border |
| Edit a node | Double-click on it, or hover and click the pencil icon that appears — both open the centered Node Editor Dialog |
| Move a node | Click and drag it to a new position |
| Delete a node | Select it and press the Delete or Backspace key |
| Connect two nodes | Drag from the small dot (handle) on the right edge of one node to the handle on the left edge of another |
| Delete an arrow | Click on the arrow to select it, then press Delete or Backspace |
When you hover over a node, small connection handles (dots) appear on its edges. Drag from one handle to another node's handle to draw a causal arrow between them.
The Minimap
In the bottom corner of the canvas, you'll see a small minimap showing the full overview of your logic model. You can:
- Click anywhere on the minimap to jump to that part of the canvas
- Drag within the minimap to pan the view
This is especially useful when your logic model grows large and you need to navigate between different sections quickly.
Drafts and Saving
While you work, MUSE keeps an unsaved draft of the canvas in your browser, so a reload or a closed tab doesn't lose your edits. A draft lives only in that browser and is removed when you sign out.
To keep a logic model, click Save. Saved logic models are stored in your workspace, appear under Logic models in the sidebar, and can be opened from any device you sign in on. See Saving & Sharing for details.